
Exciting new reporting capabilities within CMS:42
If I bought something from your website there is a good chance that your <insert name of tracker>
Our CMS database knows exactly what has been bought, by who, when, any promotion codes used and so forth. There is no amount of ad blocking that will stop that as otherwise the consumer wouldn’t get their products. We have lots of data…
We are often asked by clients for reports, often tailor made to suit their particular needs – for example: Top 40 products sold in the last year; Compare this week to the same time last year; Promotion code analysis by product code; Graphs of sales by total; Graphs of returns; the list goes on.
As a developer I don’t really like reporting requests – they’re never quite what the client wanted – either they don’t filter out a situation the client didn’t want or it is exactly the wrong shade of pink.
We have added a feature to our CMS:42 product – and will be expanding this in the future – OData (OData stands for Open Data Protocol – if you want to read more see Wikipedia. As that suggests the data is supplied in an open format. Basically, if you have some software that understands it you can use it) feeds for orders & order items. This allows you, the client, to define what data you see and what shade of pink you want it to be.
The OData feed is read only and is protected using the same login credentials as CMS:42 so there are no new passwords to remember. It is delivered over HTTPS so is secure in transmission. We also have not included personal data. This should allow you to remain compliant with data protection policies.
There are quite a number of OData compatible reporting engines available – you can even just download that data into a spreadsheet and analyse it that way. In these examples I used Microsoft Power BI (various editions are available both desktop and web based) to connect to the CMS:42 data and produce some reports.
Starting the stop watch, I am going to create a graph of sales in the last year, caveat: I am using demonstration data and will be blurring out any detail.
In less than two minutes I have created this chart:
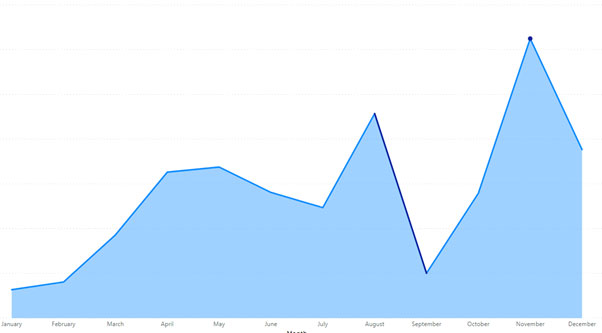
This shows that we don’t really take a lot of sales in January and a lot of sales in the run up to Christmas. There is an axis you can’t see here for the actual count.
Let’s have a chart of the top selling products in the last year. It took just a couple of minutes to produce this too:
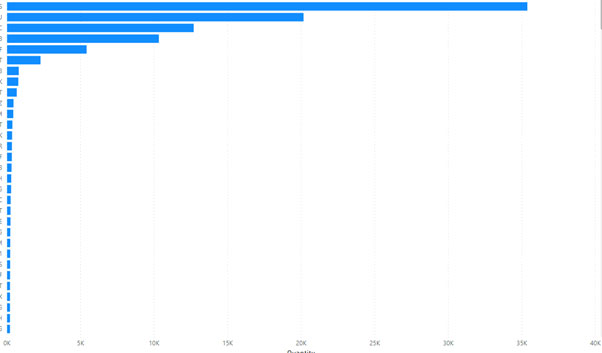
The client sold 35,000 of the top seller in the last year. I hope they have plenty as they will probably sell loads this year too! The product names are hidden.
We can even break that down to look at the top selling products by month, it took just a couple of minutes to do this too:
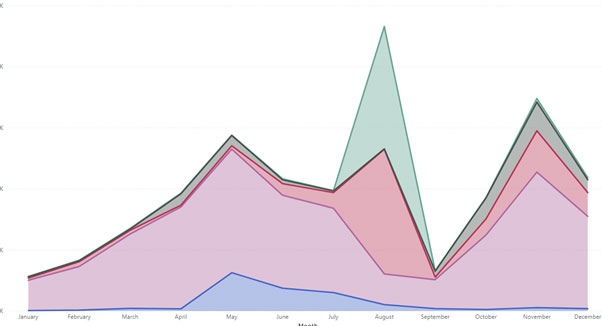
The product in green did well over the summer. And the light purple one sells pretty well all through the year.
If you don’t want a chart of the data you can just as easily produce a table.
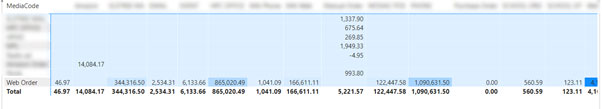
This table summarises where the order came from against a source. I’ve blurred out the sensitive data. You can also highlight interesting numbers.
Once I save the file, just like you do for a document or spreadsheet, the reports are defined – all you have to do is refresh the data. Given the size of this data that does take a minute or two.
This is a limitation of this way of doing reporting is that this isn’t totally up to date so can’t be used for up to the minute or dashboard reporting – we’re working on that! Keep coming back to catch up with our progress on that. This reporting is especially suited to monthly reporting for board packs and detailed planning analysis.
The key to all this is that you have access to your data and it might be easier, and let’s be honest, cheaper and quicker, to ask your reporting engine the questions instead of waiting for our development team to produce a report that is almost but not entirely like the report you wanted.
If you would like to know more or get this enabled for your CMS:42 website please contact us.