
What is Page Insights
Page insights (PSI) is a set of reports that provide metrics for the performance of your site/pages both on mobile and desktop devices. Beyond this it provides a list of suggestions on how that page may be improved.
Performance scores are obtained using lighthouse which collects and analyses data about the page
What is Lighthouse
Lighthouse is an automated tool used for improving the quality of webpages. It’ll run audits against sites and pages for performance, accessibility, SEO, whether your site is utilising latest technologies and more.
From the audits run reports are generated which we can store for review and action.
What do the scores mean
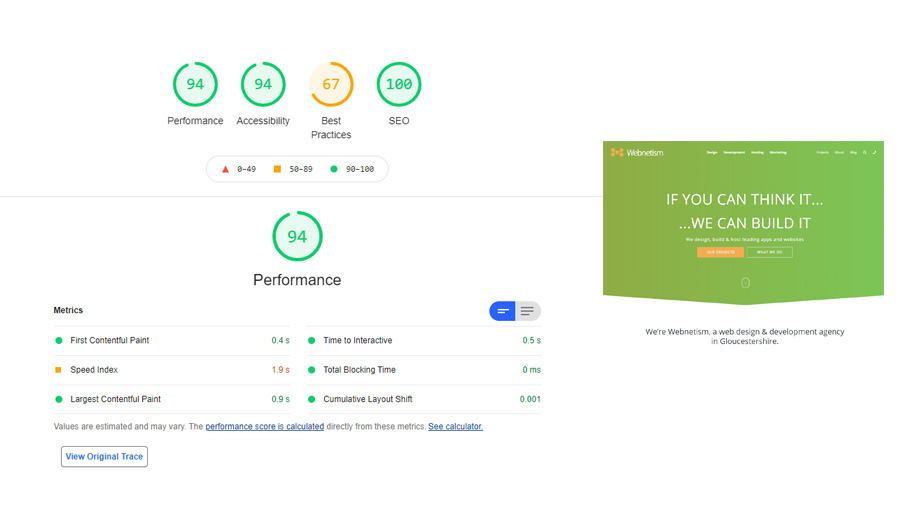
From the data provided and the reports presented by lighthouse/PSI a score will be given that summarises performance. This typically covers various metrics as well as providing an overall score.
Scores 90+ a typically considered good, where anything below that down to around 50 suggests improvements can be made. Scores below 50 are considered poor and should be the primary areas for focus when considering improvements.
Core Web Vitals
These signals are critical to all web experiences and large parts of the scores represented.
First Input Delay (FID)
Measures the time between the users first interaction with the page and when the browser can start processing responses to those actions. This metric helps measure the user's first impression of your site's interactivity and responsiveness and doesn’t consider how long processing takes.
Largest Contentful Paint (LCP)
Considers the render time of the largest image or text block visible within the viewport from when the page starts loading. The lower time the better and you should strive for this to be as low as possible, ideally below 2.5 seconds.
Cumulative Layout Shift (CLS)
Measures the visual stability of your page and helps quantify how often users experience changes in the layout, usually caused by content dynamically loading. In the best-case scenario when a page loads content would remain in the same place and not shift on the page as resources load.
Why
Inevitably Googles checklist is going to change. The Automation of the API we’re implementing will allow you see how your site and pages perform as time passes and as your site changes.
Our goal is to help improve your site and your users experience when using it. This tool will help you (and us) identify areas that can be improved. These improvements might be from a technical perspective like improving some of the underlying code or design or they might be from your perspective like improving images, setting accessibility tags or just refreshing some of your content.
What are our plans
We’re going to schedule runs against predefined pages and allow you to specify areas of interest on your site. We’ll run this tool against those pages and log the results.
Some of these latest results will be presented directly to you, allowing you to gain an understanding of how you might improve your site. We’re also going to comparing results over time and highlight any changes in performance scores, this will help better identify any areas that might need improvement or have improved as a direct result of work done on your site.
On top of the scores, we’ll provide suggestions on how you can improve the performance of your site pages.
What else might we do
History
See how your site has changed and how it has been performing over a period. You’ll be able to determine the impact changes have made as well as seeing how technology changes might have impacted performance.
Compare to similar projects
We’re going to build a store of scores from many sites. One of our future goals is to provide comparisons against similar sites or competitors to your business. We’ll aim to help you gain an edge over other websites and suggest areas in which your site and pages could perform better.
Dashboard implementation
Our clients don’t always have time to delve deep into the performance of their site so we’re building reporting directly into CMS dashboard to give you at a glance figures. This way you can remain informed about the overall performance of your website at any moment and let us know if you want us to investigate how your site might be improved.